

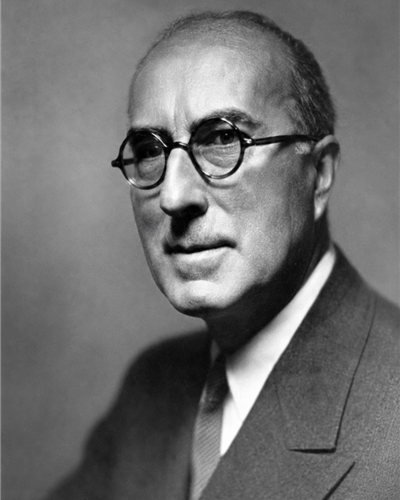
The Wyckoff method is an analytical tradition that compares price movements and traded quantities to form hypotheses about supply, demand, and market trends. It grew out of Richard D. Wyckoff's work; the phases, abbreviations, and checklists taught today also reflect later developments.
Hypothetical example — After a decline, a price fluctuates between 100 and 110. This sideways interval, or trading range, shows a pause in the decline. On its own, it does not reveal whether traders are accumulating positions through purchases or whether another decline will follow.
What is observed?
In Studies in Tape Reading, Ch. I, pp. 9–10, Wyckoff describes reading the tape, the flow of transactions, as judging the immediate trend and the relationship between individual stocks and the market. In Ch. V, he asks readers to assess volume relative to activity in the stock and the market (p. 78) and notes that these clues may be unclear or fallible (p. 83).
Chart reading compares advances, declines, traded quantities, and bar ranges: the distance between the period's high and low. Volume measures the quantity traded; it does not identify buyers, sellers, or intentions. Discretion means judging these elements together: two analysts may assign different labels to the same data.
From the market to an individual stock
ChartSchool's five-step synthesis follows this sequence:
- assess the market trend;
- compare the stock's strength with the market;
- estimate a projection using Point and Figure charts;
- apply buying or selling tests;
- assess entry timing in relation to the market.
A Point and Figure projection depends on construction and counting rules. It must be distinguished from the price that will occur and the possible loss: before applying it, define what would invalidate the hypothesis and what risk is being assumed.
Four phases and A–E schematics
The four-phase cycle distinguishes accumulation, an advance (markup), distribution, and a decline (markdown). The letters A–E, by contrast, subdivide trading-range schematics: these are two different levels of description.
Recognizing a resemblance to a schematic does not establish which phase is underway. A verifiable analysis also records alternative interpretations and developments that would lead the analyst to abandon a label, without reassigning it only after seeing the outcome.
Composite Man
Wyckoff Analytics reports, attributing it to the Wyckoff course, the idea of studying the market as if it reflected the actions of a Composite Man. This is an interpretive model; this indirect citation is not equivalent to consulting the complete course.
Historical sources and later teaching
| Source | What it documents | Attribution limit |
|---|---|---|
| Wyckoff, Studies in Tape Reading (1910), Ch. I and V | Reading transactions, volume context, and limits of judgment | These passages do not verify the origin of every modern schematic |
| Wyckoff course, cited by ChartSchool | The Composite Man reference points to section 9, pp. 1–2 | The complete course was not consulted; WorldCat supplies a bibliographic record |
| Wyckoff SMI, Library | The institute's history attributes the creek and ice metaphors to Robert Evans | This is the institute's attribution within its own teaching tradition |
| Jim Forte, Anatomy of a Trading Range (1994), pp. 48–50 | SMI accumulation schematic with A–E phases | It documents this presentation, not the first invention of the letters |
| Pruden and Belletante, Wyckoff Laws and Tests | Presentation of three laws and nine buying tests | The 2015 CMT page republishes an earlier text; it does not date its origin |
The table distinguishes original documents, indirect citations, and accessible syntheses. It does not establish a complete genealogy of every rule. In particular, a checklist's presence in a modern source neither proves nor rules out that parts of it already appeared in the historical course.
Study path
To begin, follow the short path:
- Three laws — the vocabulary of analytical principles.
- Five steps — the order of analysis.
- Nine buying and selling tests — checks used in the teaching synthesis.
Then explore Composite Man, trading ranges, and the Accumulation A–E and Distribution A–E schematics. The sources cited here explain a method; they do not establish a universal forecasting edge or a financial result.
Sources
- Richard D. Wyckoff, Studies in Tape Reading (1910), University of California scan, Ch. I, pp. 9–10; Ch. V, pp. 78 and 83.
- Richard D. Wyckoff, The Richard D. Wyckoff Method of Trading in Stocks, WorldCat record, undated in the record consulted; this is not the course text.
- Wyckoff Analytics, Wyckoff Method, “Wyckoff's Composite Man” section: course quotation reported by the modern source.
- StockCharts ChartSchool, The Wyckoff Method: A Tutorial, “A Five-Step Approach to the Market” and “Wyckoff's Composite Man” sections.
- Henry O. Pruden and Bernard Belletante, Wyckoff Laws and Tests, republished by CMT Association, September 2015; sections on the three laws and nine tests.
- Jim Forte, Anatomy of a Trading Range, MTA Journal, Summer–Fall 1994, pp. 47–50.
- Wyckoff Stock Market Institute, Library, “History Of Wyckoff SMI” section, passage on Robert Evans.