

The CycleSic interface separates five things: the market, the screen view, the analysis mode, visible overlays and the camera position. Understanding that difference prevents a visual change from being mistaken for a new analytical result.
Transparency — Cyclepedia and Emiciclo share a publisher. This page describes the verified interface without exposing the mathematical logic inside the views.
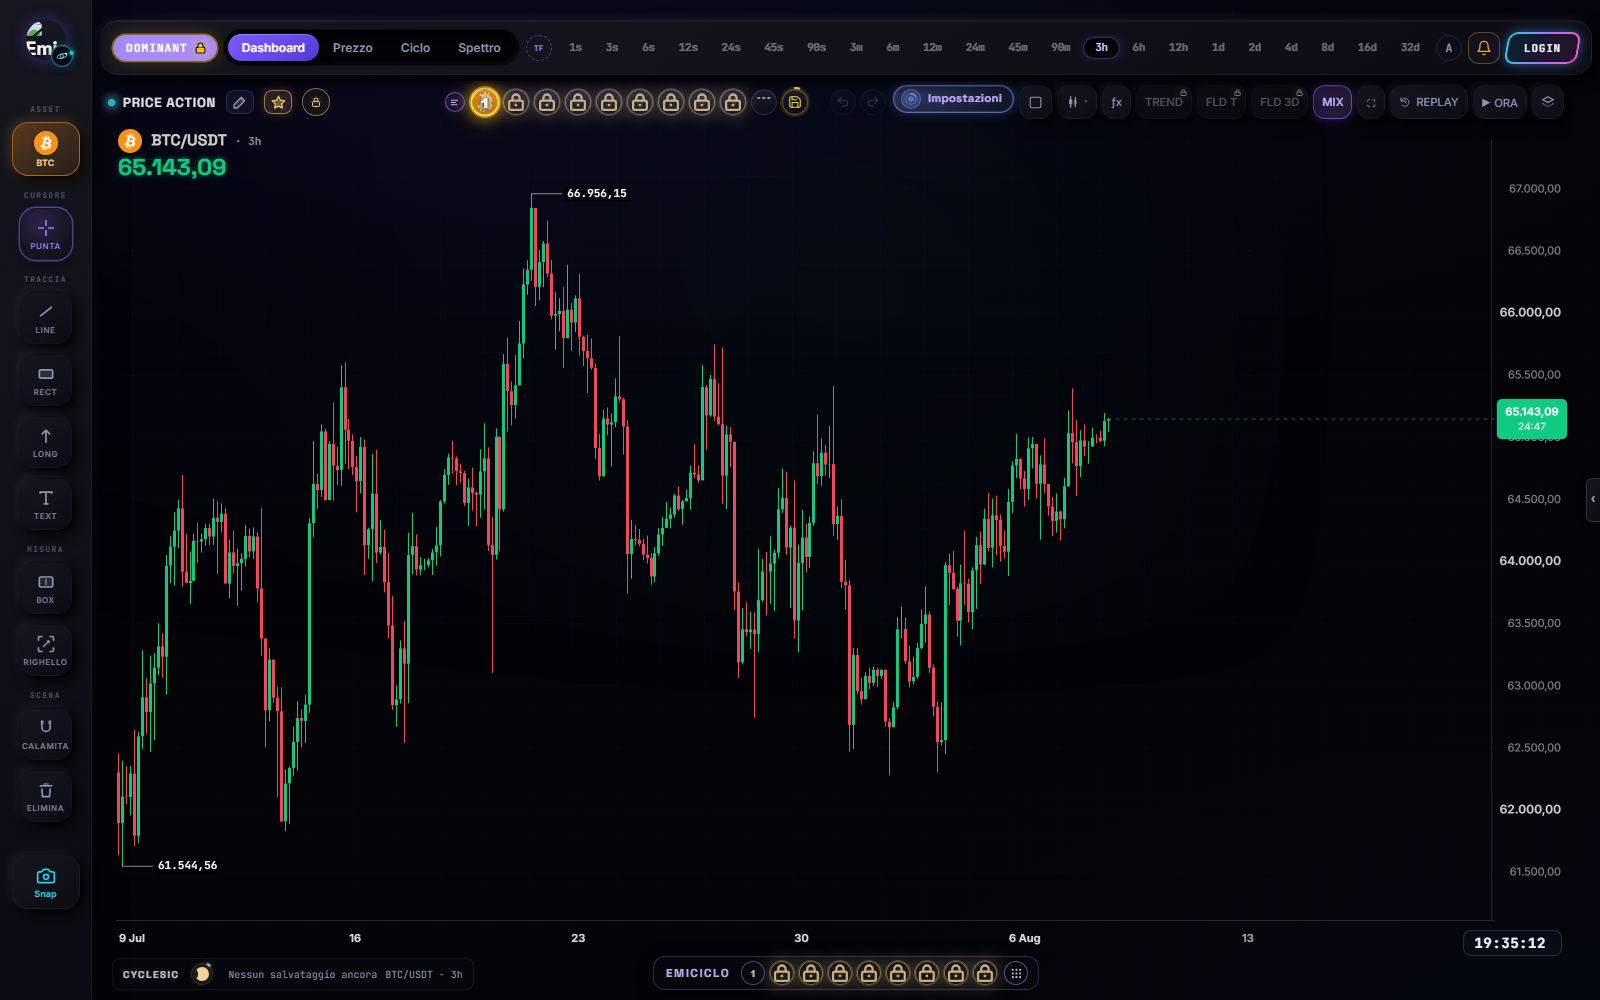
Main areas
- Use the top bar to choose the asset and timeframe. Timeframes in the bar are grouped by unit (minutes, hours, days…). Auto cycles the visible intervals on its own. Reread both after a change.
Dashboard,Price,CycleandSpectrumredistribute panels without changing the market.- The mode pill, such as
LEGACYorDOMINANT, changes the analysis configuration when available. MIX,TREND,FLD TandFLD 3Dshow or hide connected surfaces. If MIX is off, the head pill turns it on; it does not cycle presets.- On a wide desktop the right-hand column holds the object tree, watchlist, ƒx, Cycle Intelligence, alerts, drawings, overlays and Trade ON (
$). A click on another icon opens that pane. - The side dock controls the cursor, drawings and measurements; Settings opens the circular hub.
A lock means that the feature is not available in the current session. It does not mean that the analysis returned zero.
Trade ON
The $ command opens the overlay of positions from connected exchanges. It is not a broker and it does not send orders. On desktop the menu opens to the left of the button, with a switch per platform and a global off control. A lock means the required access is missing (Charter or Cycle Analyst), not a market result.
Turning every exchange off removes positions from the chart; it does not delete history on the exchange account.
View, mode and overlay are different
A view decides how much space a panel receives. A mode selects an analysis configuration. An overlay adds or removes a reading from the chart. Changing one of them should not change the asset or timeframe by itself.
Practical check: change one control, watch which label becomes active and inspect what changes on screen. If the terminal is still moving or loading, wait before interpreting the result.
Dashboard, Price, Cycle and Spectrum
Dashboard keeps price and cyclic context together. Price gives the market chart most space and is suitable for candles, indicators, drawings, alerts and clean snapshots. Cycle prioritises the cyclic or detrended representation associated with the current analysis. Spectrum expands the surface that organises periodicities observed in the sample.
None of these views produces certainty. A cyclic line is not an alternative price path, and a prominent period in the spectrum is not guaranteed to persist.
Navigate the chart
With selection/navigation active, drag the time window, use the wheel or supported gesture to zoom, work on the vertical axis to change the visible scale, and use the cursor to read time and value. Reset the view if candles have moved off screen.
A saved layout may restore its stored viewport. If the saved candles are no longer loaded, CycleSic can fit the view to available data rather than reproducing an empty area.
FOCUS OUT, FOCUS IN and NOW
FOCUS changes the framing, not the data. OUT gives a wider view of the context; IN moves closer to the present. Use the visible control or, on desktop when no text field is active, the space bar.
NOW returns the camera to the current candle and can keep following it. If you move into the past, new data still arrive; you are simply not looking at them. Select NOW to return.
Expected result: the visible window changes while symbol, timeframe and analysis remain the same.
On desktop, a click-and-hold on the price chart switches between Dashboard (composite and spectrum below) and Price (those panes collapsed). Cycle Intelligence does not open or close with this gesture: it stays as it was.
When you change timeframe
The transition can briefly freeze the current picture and then move candles and panels together. Do not read values from the old interval as if they already belonged to the new one.
Wait until the new timeframe is highlighted, the movement ends and the panels finish updating before comparing the result.
Expand or restore panels
On desktop, double-click and panel controls can expand or restore a surface depending on context. On mobile, controls appear in a compact bar and through dedicated gestures. If a gesture is unclear, open Settings → Tutorial → Gesture tutorial.
Expected result when changing view: the selected tab becomes active and panels are rearranged while asset and timeframe remain unchanged.
If it fails
- Tab does not change: wait for calculations and close overlapping menus.
- Surface is blank: reset the view, then check data and access.
- Panel is missing: return to Dashboard and check whether it is collapsed.
- Chart moves while drawing: inspect the active dock tool.
Sources
- CycleSic in the Emiciclo app — operating interface.
- CycleSic manual — complete path.
- Cyclepedia technical check: verified on 2026-08-28 against
cyclesic-v2/desktop chrome, right-hand column, Trade ON, MIX, view handling, FOCUS OUT/IN, the NOW camera and timeframe transitions.