

In plain language — CycleSic places numbers and letters on selected price turns to propose one possible reading: 1–5 for the impulse and A–B–C for the correction. It does not tell you to buy or sell.
Transparency and trade-secret boundary — Emiciclo produces CycleSic and publishes Cyclepedia. This guide documents visible controls and results. It does not disclose formulas, weights, thresholds, selection rules or other protected parts of the engine.
Before you start
Open CycleSic, choose an asset and timeframe, and check that the chart has a regular history. Elliott Wave is an Emiciclo study calculated on the server: a lock on the card means the required access is missing; a service failure must not be interpreted as “no wave”.
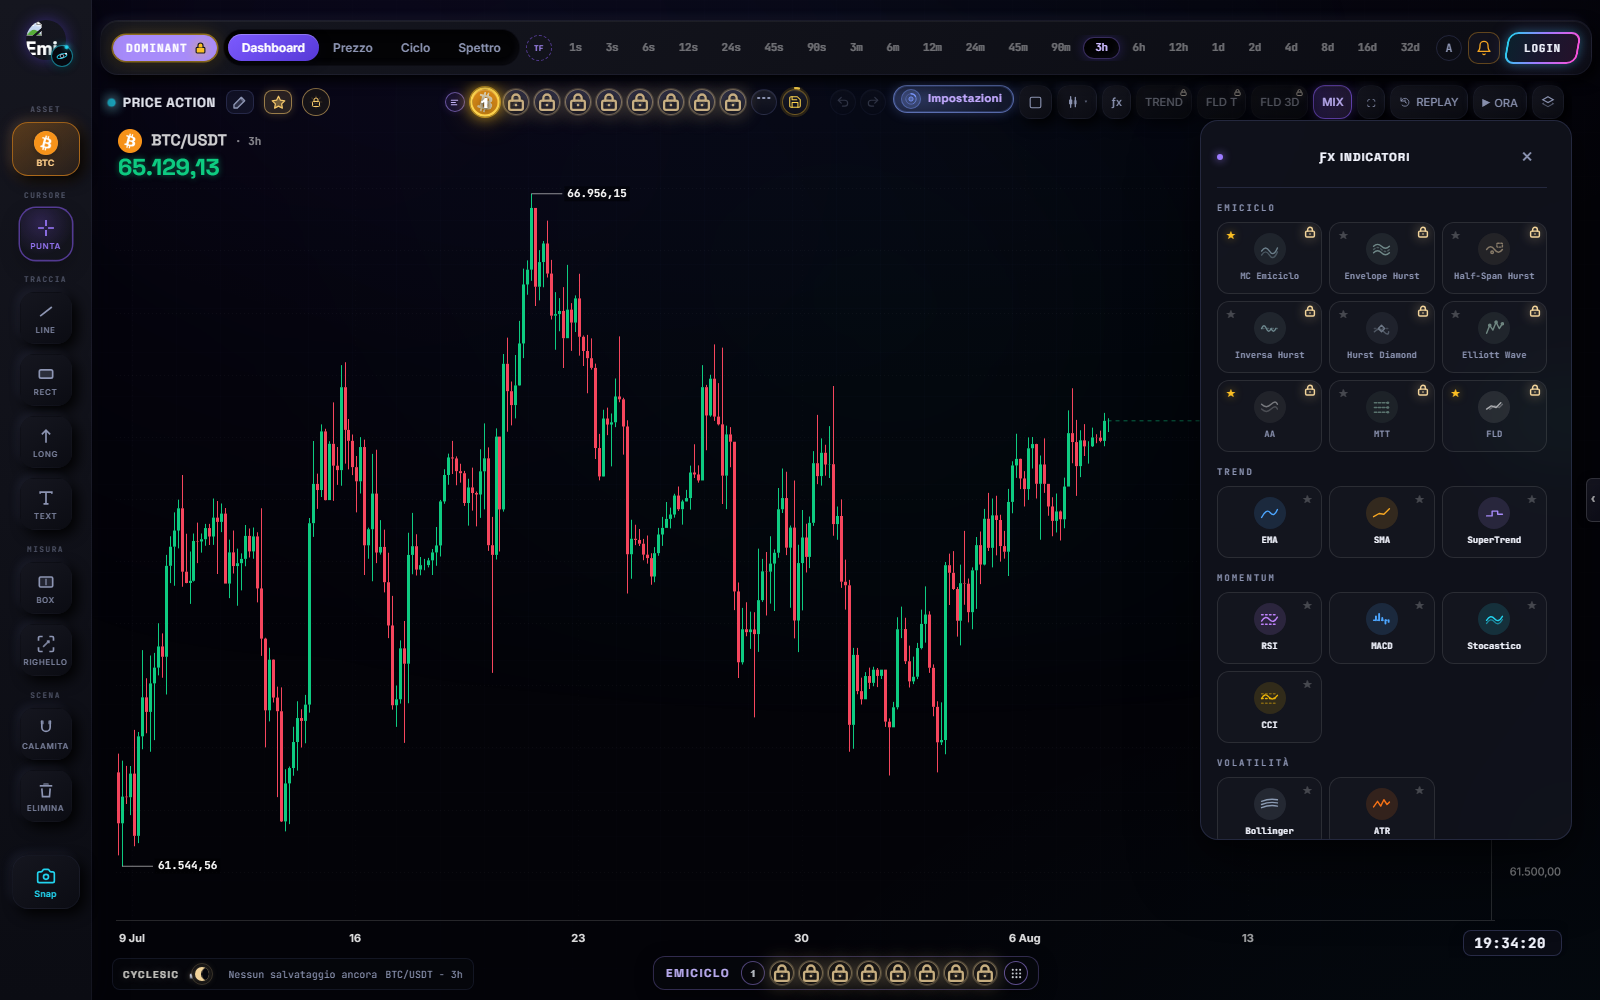
Enable Elliott Wave
- Select ƒx Indicators.
- Open the EMICICLO family and choose Elliott Wave.
- Enable the study and close the catalogue.
- Wait for calculation, then open the indicator panel on the chart.
Expected result: the Elliott Wave name and status panel appear; when a valid count exists, the structure and its labels are drawn. Enabling it again opens the existing instance instead of adding a duplicate.
Read the result in the right order
Start with the status. “No count” is a possible result: with those data and settings, the engine is not exposing a current structure. Other states distinguish an impulse in progress, a completed 1–5, a completed A–B–C and an invalidated count.
Then read:
- Bull or Bear direction: the direction of the displayed structure, not an order.
- 0–5 and A–B–C labels: they sit on confirmed pivots, so they appear a few bars after the swing.
- Reliability: how strongly the current count meets the engine's criteria. Even when shown as a percentage, it is not the probability of a future rise or fall.
- Orange line: the current count's invalidation. Its reference can change with the stage; it is not your broker stop-loss.
- Purple bands: W4, W5, correction or C zones compatible with the current stage. They are neither guaranteed prices nor automatic orders.
When 1/N appears, several candidate counts exist. The panel is showing the one selected by the engine, not the only possible interpretation.
Settings that change the display
Cyclic pivot adapts sensitivity to the available dominant cycle. When it is off, Pivot confirmation provides manual control: greater confirmation filters smaller swings, while lower confirmation reveals more of them. Compare the same asset and timeframe, and change one control at a time.
You can also show or hide A–B–C search, the structure line, invalidation, expected zones and the panel. Hiding an element changes the display; it does not prove that a level or state does not exist.
Alerts: what they can report
Elliott alerts record events that have already occurred: count found, wave 5 completed, A–B–C completed, count invalidated or structure changed. They bring you back to the chart; they do not predict the next wave. Use the Alerts chapter to create them and inspect their history.
If it does not work
- Locked card: check the session and access shown by the app.
- Blank or loading study: check network, history and service state; a technical error is not “no count”.
- Panel says “No count”: verify the data and timeframe first. Do not tune settings until the preferred shape appears.
- Labels appear late: this is expected because a pivot is displayed only after confirmation.
- Count changed: new data may confirm a different structure; record the asset, timeframe, time and settings if you need to reproduce the reading.
Limits you need to know
Automatic counting does not remove the ambiguity of Elliott analysis. It depends on data, timeframe, pivot sensitivity and new bars. The verified version searches for impulses and zigzag corrections; it is not documented here as covering flats, triangles, diagonals, nesting or several simultaneous degrees.
The engine runs on the server and sends the browser only what it needs to draw the result. Cyclepedia explains observable inputs, outputs and limits without reverse-engineering the algorithm. Treat Elliott Wave as a structured hypothesis to check, never as sufficient evidence for a trade.
Sources
- CycleSic in the Emiciclo app — current operating interface and access state.
- Pattern Recognition: Your First Step to Using Elliott Waves — summary of the modern motive/corrective codification.
- Corrective Waves — variety and identification difficulty of corrective structures.
- Elliott Wave Principle by Frost and Prechter — a later codification of R. N. Elliott's writings.
- Ralph Nelson Elliott — historical origin, works and attribution limits.
- Cyclepedia technical check: reviewed on 16 August 2026 against the CycleSic registry, panel, renderer, alert events and output contract; proprietary formulas and rules excluded.