

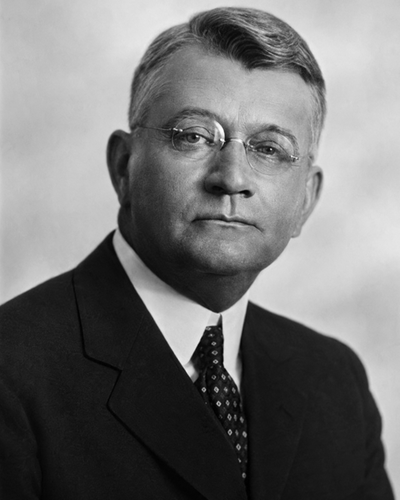
In simple terms — Ralph Nelson Elliott observed that market movements seemed to form recurring, nested shapes. He called this reading the Wave Principle. He did not invent an automatic signal, nor did he leave a guarantee of prediction.
Master path
Study Ralph Nelson Elliott in a clear order
Begin with the essential idea, move to the procedure, and finish with what can invalidate the reading.
- Start here The Wave Principle (1938): work, context, and Elliott corpus What Elliott actually published from 1938 to 1946, how the vocabulary changed, and why original sources must be separated from later manuals.
- Understand the model The 5–3 structure and wave degrees in the Elliott tradition How to read five waves in the larger direction, three in correction, and nested structures without confusing direction, scale, and timeframe.
- Testing and limits Elliott wave counts: patterns, rules, alternatives, and limits A disciplined method for separating motive and corrective waves, applying rules and guidelines, retaining alternatives, and stating invalidation.
Who he was
Ralph Nelson Elliott (1871–1948) was an American accountant and consultant. George A. Schade’s biographical research documents a career that included Mexico and Central America before Elliott’s intensive study of stock indexes in the 1930s. His chart work therefore came late in life; it was not an extension of a career as a broker.
That distinction matters. His historical authority comes from published observations that can be checked in books and articles, not from a retrospective legend about a “market prophet.”
What he published
Elliott introduced the method in the typewritten 1938 monograph The Wave Principle. In 1939 he brought it to a wider audience through twelve Financial World articles. He produced essays and educational material from 1940 to 1942, then published Nature’s Law: The Secret of the Universe in 1946, broadening the discussion to Fibonacci, nature, and collective behaviour.
The Elliott Tradition path follows that chronology instead of treating all the texts as one manual written at the same time.
The documented contribution
At its core is a grammar of direction and scale. A movement aligned with the structure one degree larger tends to develop in five parts; the response against that direction tends to develop in three or in a corrective combination. Each segment may contain a smaller structure and may join other segments to form a larger one.
“Five up and three down” is wrong when the larger movement is bearish: the directions reverse. The page on the 5–3 structure and wave degrees therefore begins with degree, not screen direction.
What came later and the limits of attribution
A. J. Frost and Robert Prechter made the material more systematic and popular in their 1978 textbook. W–X–Y notation, many modern classifications, counting preferences, and the familiar teaching format belong to that codification or to later authors.
This does not make them useless. It means that historically precise writing must identify author and date. Not every formula called an “Elliott rule” appears in the same words in the 1938 monograph.
How to study him without myth
A count is a hypothesis applied to observed data. It may change as new bars arrive or as the analyst corrects the degree. A serious application retains a main count, at least one plausible alternative, and a level that makes each reading incompatible with its own rules.
The counting chapter also separates rules, guidelines, and proportions. A Fibonacci ratio may suggest an area; by itself it does not prove that the selected label is correct.
Advanced level: attribution and testing
Words such as “fractal” and “self-similar” are useful modern descriptions, but they should not be placed retroactively in Elliott’s vocabulary. He described degrees and forms recurring at different scales. Likewise, a successful historical call does not demonstrate out-of-sample effectiveness after costs under rules fixed in advance.
Cyclepedia therefore presents the Wave Principle as an influential pattern-recognition tradition: it documents origin, language, uses, and limits. CycleSic’s Elliott Wave software remains a separate product, with its own manual and without projecting its proprietary algorithm onto the historical texts.
Sources
- R. N. Elliott, The Wave Principle, 1938 — bibliographic record of the original work.
- R. N. Elliott, Nature’s Law: The Secret of the Universe, 1946 — bibliographic record.
- George A. Schade Jr., “Ralph Nelson Elliott”, CMT Association, 2008 — biography and publication chronology.
- University of Pennsylvania, Financial World archives — digitised 1939 volumes.