

The Sundial places each cycle degree on a path. It helps you see where each scale sits relative to a projected turn and a later observable confirmation.
Essential idea — A turn is a model projection; confirmation requires the condition shown by the interface to occur. They are not synonyms.
Documentation boundary — This page explains visible labels, actions and outputs. It does not disclose internal periods, formulas, weights or calibration.
Satellite and Linear
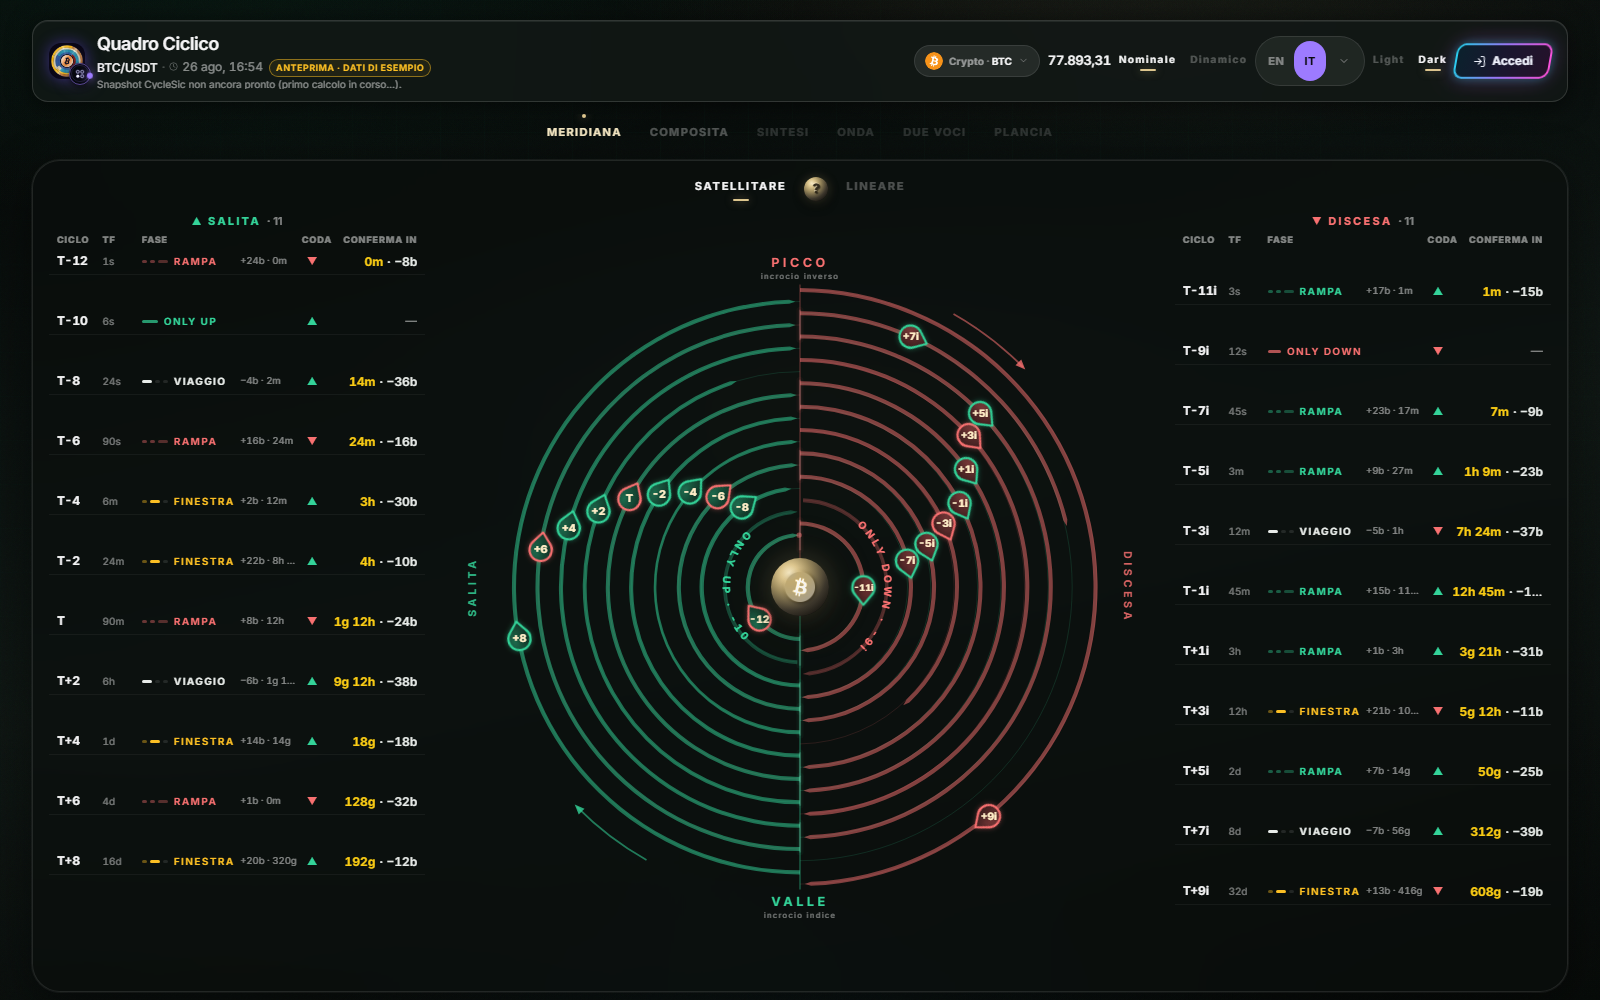
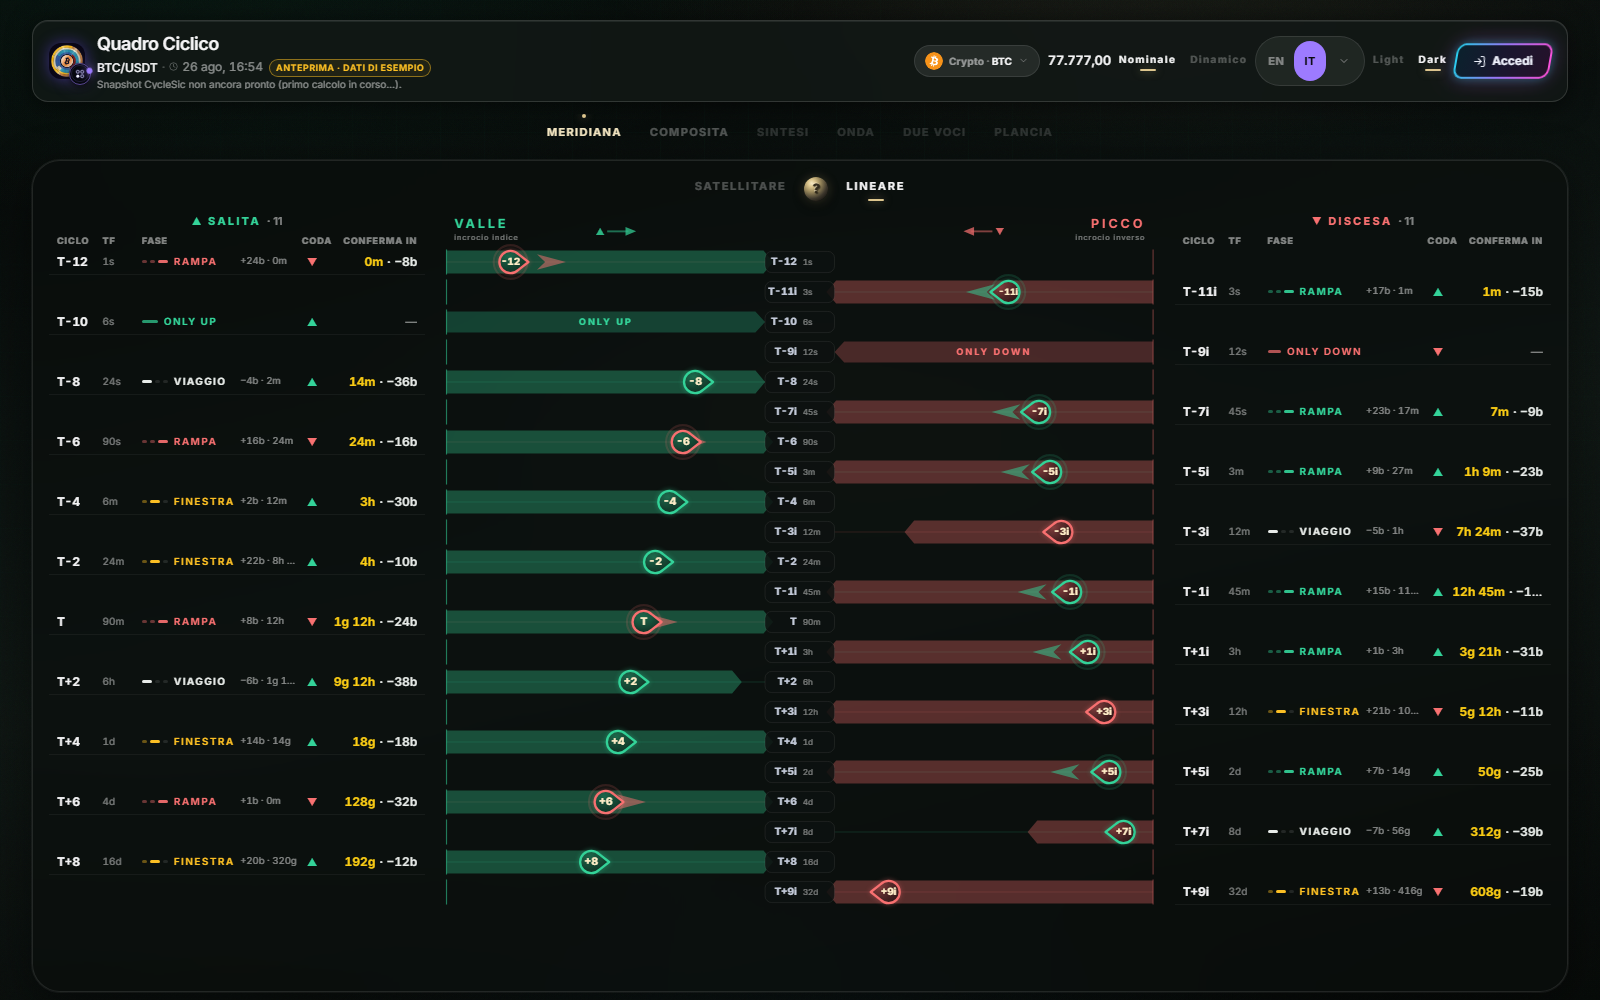
Satellite / Linear changes the representation of the same snapshot. Satellite uses rings, trails and dots. Linear places each degree on a horizontal track, with peak on the left and trough on the right. Switching representation does not request a new market event or create a confirmation.
The three phases in plain language
En route means the degree is still travelling toward the projected turn area.
In window means the time projection has been reached or passed, but the preliminary condition displayed by the Board is incomplete.
On ramp means the projection has passed and the preliminary condition is on the required side; the displayed cross confirmation is still pending. Pulsing draws attention but does not create a certain signal.
Open a degree detail
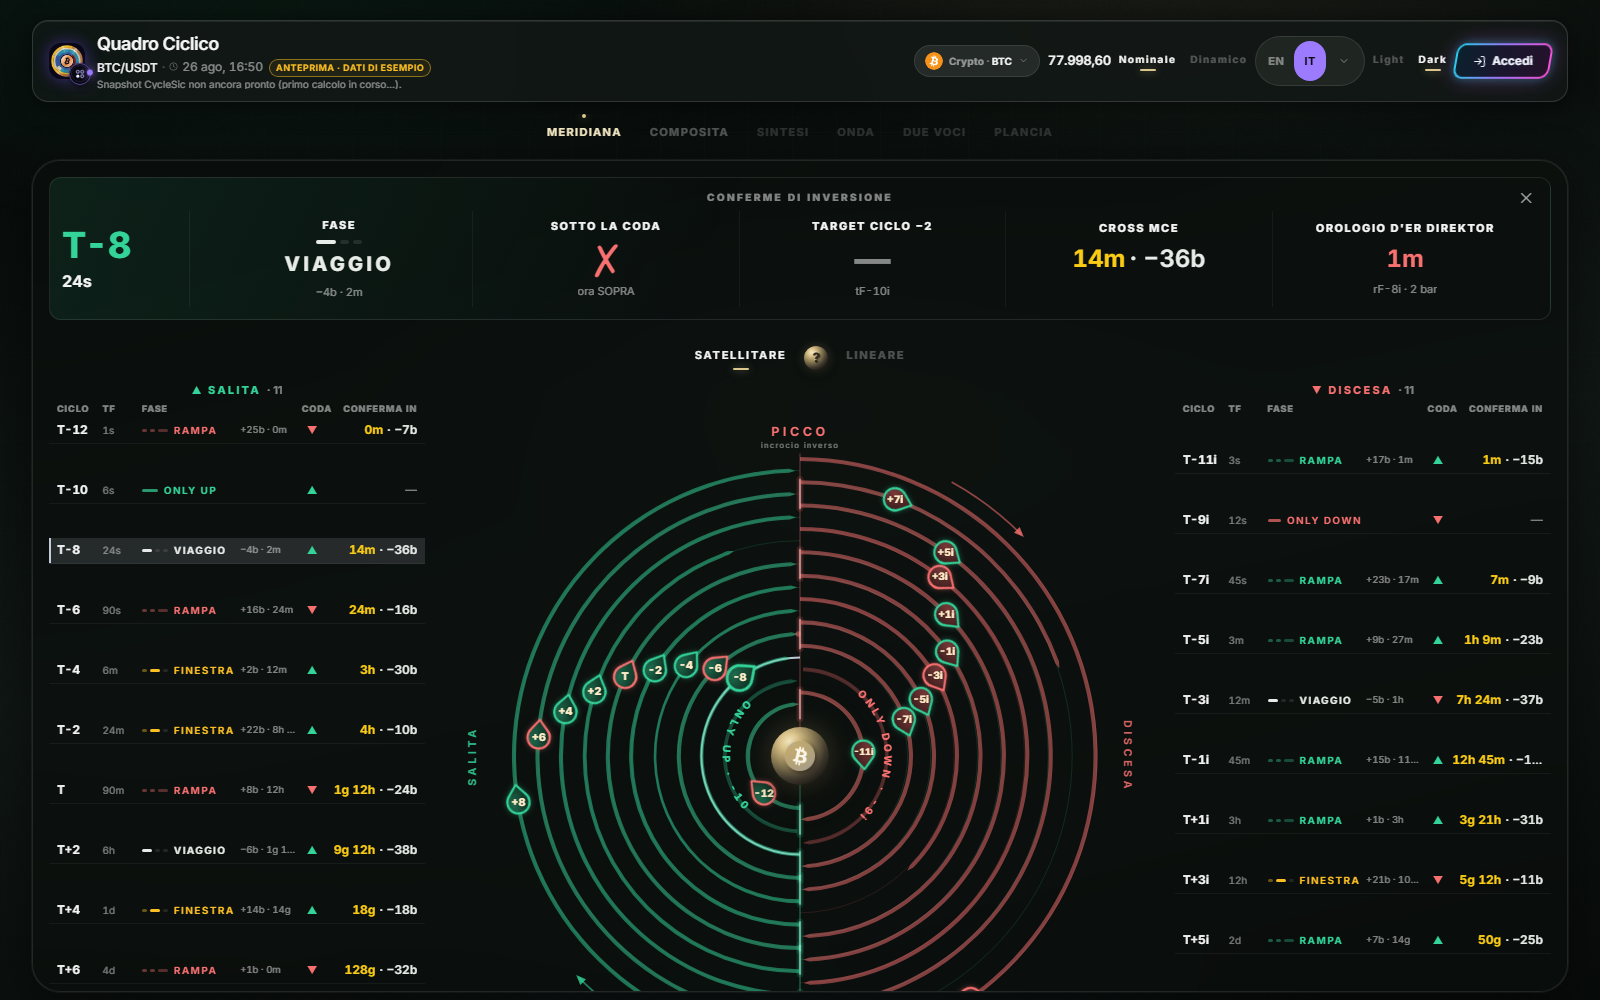
- Tap a satellite, a selectable ring or its table row.
- Read the degree and timeframe in the card.
- Check
Phase, tail side and projected appointment. - When available, check the confirmation countdown and related target.
- Close the card or select another degree.
The expected result is one card for one degree. Colors, trails and dots describe the model state; none prescribes entry, direction or position size.
Professional reading
Similar degrees may describe alignment, but they do not automatically multiply a probability. Return to the CycleSic chart, verify price and timeframe, define invalidation and apply risk management independently of the Board color.
Sources
- Cyclic Board in the Emiciclo app — official Sundial view.
- Cyclic analysis — theoretical context.
- Cyclepedia technical verification: labels, degree selection, Satellite/Linear modes and detail card checked on 2026-08-25.