

CycleSic is the cyclic-analysis terminal in the Emiciclo ecosystem. It brings together charts, market data, spectral tools and cyclic indicators to study periodicity, phase and possible time windows. It is not a system that knows future prices in advance: its outputs require data checks, interpretation and risk management.
Transparency note — Emiciclo publishes Cyclepedia and produces the software described here. This page combines official documentation with a user guide: it is not an independent review or financial advice. Features, access and conditions were checked on the stated date; limitations receive the same prominence as capabilities.
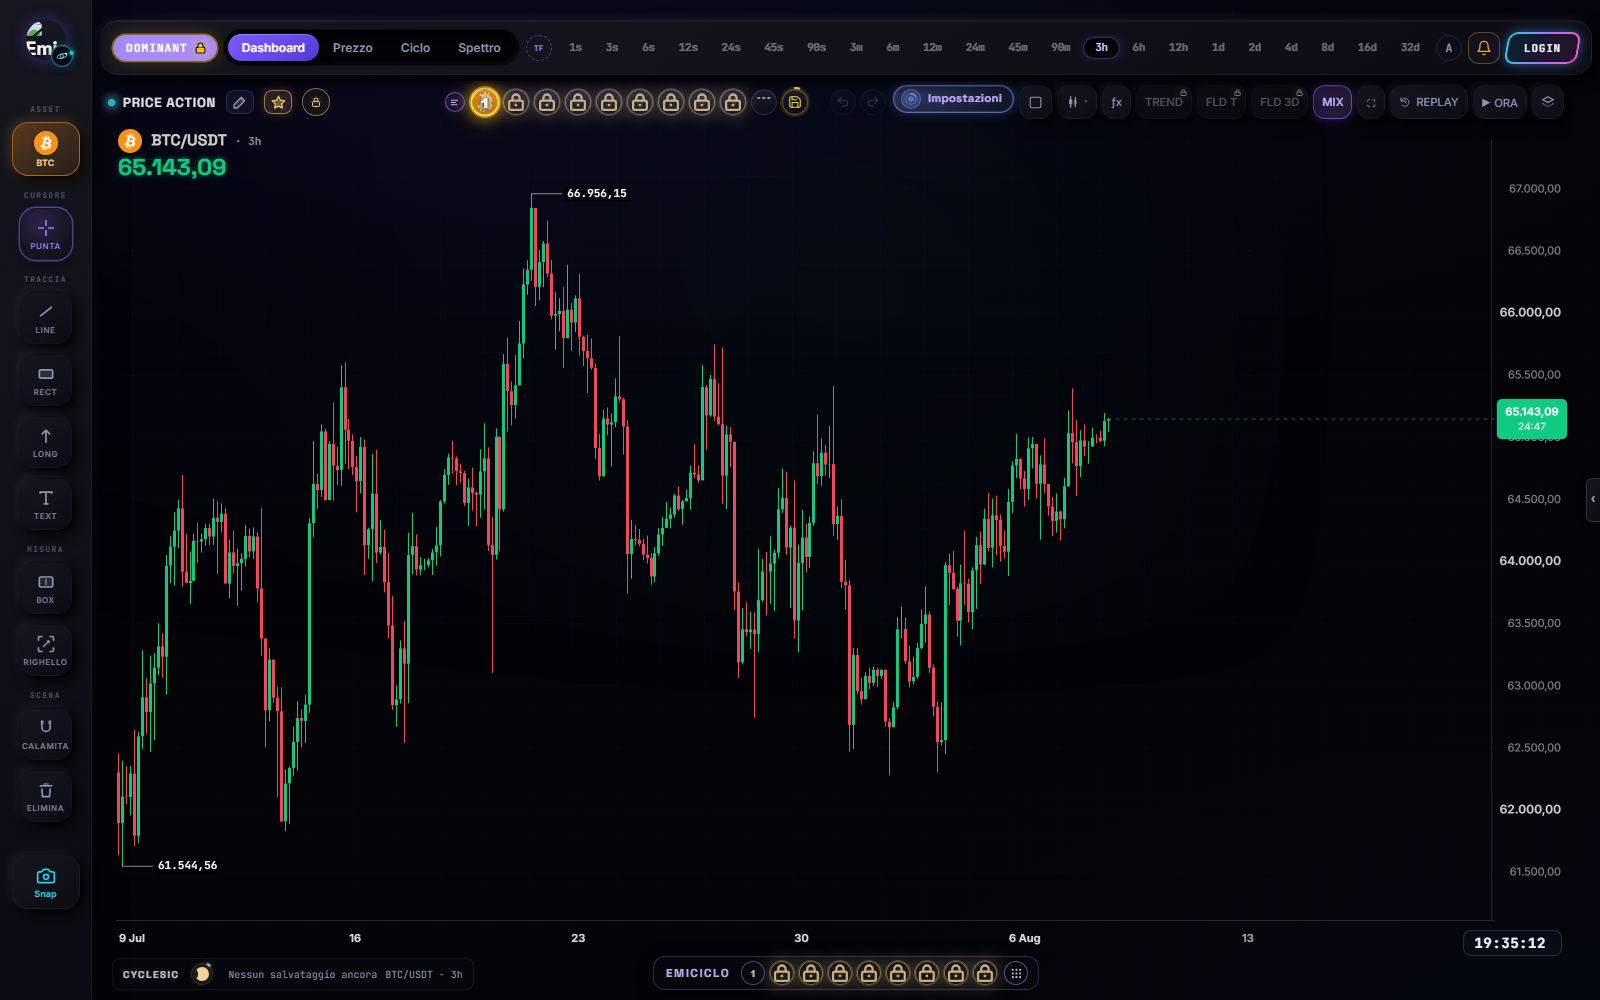
Need instructions? Open the CycleSic technical manual for task-based procedures and real screenshots covering data, views, indicators, drawings, layouts, settings, mobile use, alerts and troubleshooting.
How to read the diagram — Select one of the six stages, or use Tab and the arrow keys. The explorer shows the verified detail and a link to the relevant section.
Who it is for and prerequisites
CycleSic is intended for readers who want to observe the market through several tools in one environment:
- a beginner can use it to learn the difference between price, timeframe, indicator and cyclic hypothesis;
- an intermediate user can compare periodicity, phase, FLDs, harmonics and composite waves;
- a professional can include it in a broader analysis, validation and review process.
Before starting, it helps to understand at least candles, timeframes, the difference between a closed observation and one still forming, and risk per trade. Some features may require authentication or a particular access level: the current interface, not this page, is the operational source for available permissions.
What it does and does not do
The terminal lets you:
- choose a market, symbol, interval and amount of history to inspect;
- organise worklists (ALL versus personal coloured dots, including the default purple Emiciclo list);
- read price on a chart and add standard or cyclic indicators;
- run spectral analyses, including DFT and assessments based on the Bartels test;
- build or inspect a composite made from cyclic components;
- view FLDs, harmonics, the spectrum and related tables;
- save snapshots, presets or layouts when the profile and access level allow it;
- import CSV data in workflows where that option is exposed;
- follow the built-in learning path and the mobile gesture tutorial.
CycleSic does not:
- certify that a past cycle will continue with the same duration or amplitude;
- turn a spectral peak, an FLD crossing or a composite wave into an automatic instruction to trade;
- remove noise, parameter-review needs, execution costs or model risk;
- replace a plan, a coherent stop or independent checking of the data;
- provide financial advice or guarantee returns.
Interface map
| Area | What to check | Useful question |
|---|---|---|
| Market and timeframe | symbol, interval, historical depth | Am I comparing like-for-like data? |
| Worklists | ALL versus a personal list, including the purple Emiciclo dot | Am I looking at the catalogue or at three default markets? |
| Chart | candles, scale, last bar, zoom | Is the last candle closed or still changing? |
| Indicator catalogue | standard and cyclic families, parameters | What does this indicator actually measure? |
| Cyclic analysis | spectrum, components, significance, phase | Is the result stable when the sample changes? |
| FLDs and harmonics | associated period, interaction with price | Am I reading a relationship or inventing a signal? |
| Composite | included components, alignment, horizon | How strongly does it depend on the selected assumptions? |
| Layouts and profile | saved items, presets, enabled features | Is this a technical limit or an access limit? |
| Learn | tour, chapters and gesture tutorial | Can I explain the output before using it? |
Labels may vary with language, screen size and updates. In languages not yet native to the terminal, some areas may fall back to English.
Essential tutorial, step by step
- Open the terminal. Confirm that you are in CycleSic and check whether the interface reports a session issue or a locked feature.
- Choose one symbol and one timeframe. Do not begin by comparing many markets; first verify the scale, timezone and amount of history.
- Read the chart without indicators. Identify the last closed candle, volatility and data discontinuities. An incomplete base makes every later calculation fragile.
- Add one indicator at a time. Open its information panel and note its inputs, units and the question it is meant to answer.
- Start the “Learn” path. The built-in tour introduces the interface, analysis and relationships with other Emiciclo environments. On mobile, complete the gesture tutorial as well.
- Compare the result. Change the historical window or timeframe deliberately and observe which components remain and which disappear.
- When using the spectrum or Bartels, separate strength from certainty. Relative statistical evidence in the sample does not promise future persistence of the cycle.
- When using an FLD or composite, write the reading rule first. Define what would invalidate the hypothesis; do not rewrite the explanation after the move.
- Save only configurations you understand. A layout filled with correlated indicators is not the same as several independent confirmations.
- Take the decision outside the chart. Before any trade, apply the risk, size and no-trade conditions already defined in your plan.
How to read the outputs
| Output | Cautious reading | Main limitation |
|---|---|---|
| Spectrum / DFT | describes how much selected frequencies explain the series in the sample | changes with window, noise, trend and sampling |
| Bartels test | helps assess the relative regularity of a periodicity | does not prove that the periodicity will continue |
| Composite | adds selected components to display a cyclic trajectory | inherits every choice about period, phase and amplitude |
| FLD | relates price to a displaced line for the observed period | a crossing alone is not a complete signal |
| Harmonics | compares components linked by period ratios | nearby components may be collinear or unstable |
| Forecast or radar | makes a model-expected zone visible | an expected zone is not a certain event or a price forecast |
A useful output should remain understandable when its sample, parameters and invalidation condition are stated. If the conclusion depends on one setting discovered after many attempts, selection risk is high.
Data, access and privacy
- Data may come from market services connected to the terminal, Emiciclo server engines or a CSV uploaded by the user, depending on the feature.
- Always check symbol, market, interval, timezone, completeness of history and any gaps. Similar tickers do not guarantee identical series.
- The V2 terminal is integrated into the app through a same-origin surface and uses a session token for profile-linked features.
- Available layouts, indicators, engines and other capabilities may depend on the access level. This guide does not reproduce prices or commercial thresholds because they can change.
- Before uploading a CSV, remove unnecessary personal columns and keep a copy of the original source.
- For personal data, cookies and data-subject rights, read the official privacy notice.
Troubleshooting
The chart does not load or shows little history
Check the connection, symbol, timeframe and provider; temporarily reduce the requested depth and try again. If the problem affects one market only, do not fill the gap with a different ticker without disclosing the substitution.
An indicator remains empty
Check that there is enough history for the selected period, that the candle is available and that the required engine is included in your access. An engine-authentication error is not a zero result.
The result changes sharply when the window changes
Do not search for the parameter that confirms the thesis. Record the windows compared, narrow the conclusion and treat the result as unstable.
A layout or feature is locked
Check the session and profile, then the current access page. Signing out and back in may realign the token; do not buy a plan based on an outdated description or on this guide.
Zoom and drag gestures become confused on mobile
Start the built-in gesture tutorial. Before interpreting the chart, verify that you did not move the scale, panel or interval unintentionally.
Relationships in the ecosystem
- Office stores journal entries and analytics; in enabled workflows it can bring the context of connected positions onto the CycleSic chart.
- Cyclic Dashboard reuses cyclic-computation services for a concise multi-timeframe reading; it is not simply a copy of the terminal.
- Cyclepedia explains theory, terminology and tool limitations without replacing the operational interface.
- Emiciclo Method is the educational and interpretive layer; CycleSic is a tool, not automatic proof of the method.
Version check
This guide was checked on 2026-08-08 against the public routes, CycleSic V2 wrapper, access contracts and teaching modules in the Emiciclo runtime. Desktop chrome, worklists, Trade ON and the PWA/Windows tab + were rechecked on 2026-08-28. The original check confirmed the terminal, same-origin iframe, tour, cyclic tools and differentiated access. Exact commercial limits, prices and temporary service availability are deliberately excluded.
To verify a later change, compare the route opened, feature name, data source, session state and access message in the app. If one differs, treat the current interface as newer than this entry and report the editorial correction to Cyclepedia.
Sources
- CycleSic in the Emiciclo app — operational interface and current feature availability.
- Official Emiciclo website — ecosystem identity and access to public services.
- Official access and plans — current source for permissions and commercial conditions, not reproduced in this guide.
- Emiciclo privacy notice — data processing and controller contact details.
- Cyclepedia technical check: editorial comparison on 2026-08-08 with
src/products/cyclesic/,cyclesic-v2/, application routes, entitlements and tutorials in the runtime repository; 2026-08-28 recheck of desktop chrome, worklists, Trade ON and the tab strip. Product sources remain separate from theoretical sources on cyclic analysis.
Related Cyclepedia pages
Operational access
Open CycleSic in the official app — neutral external link. Before using an output, check the data, version, access and limitations shown in the interface.