

The Composite view stacks several timeframes. Each row compresses a cyclic reconstruction into a short shape so you can see where neighboring scales appear to agree or diverge.
Essential idea — The shape summarizes the sample under the current mode. It is not future price and not a trading signal.
Documentation boundary — The manual explains visible elements and control behavior. Components, formulas, thresholds, weights and calculation procedures remain proprietary.
Open and orient yourself
- Select
Composite. - Wait until
Computing composites…disappears. - Check asset, timestamp and mode pill.
- Read rows by timeframe and do not compare shapes from different update times.
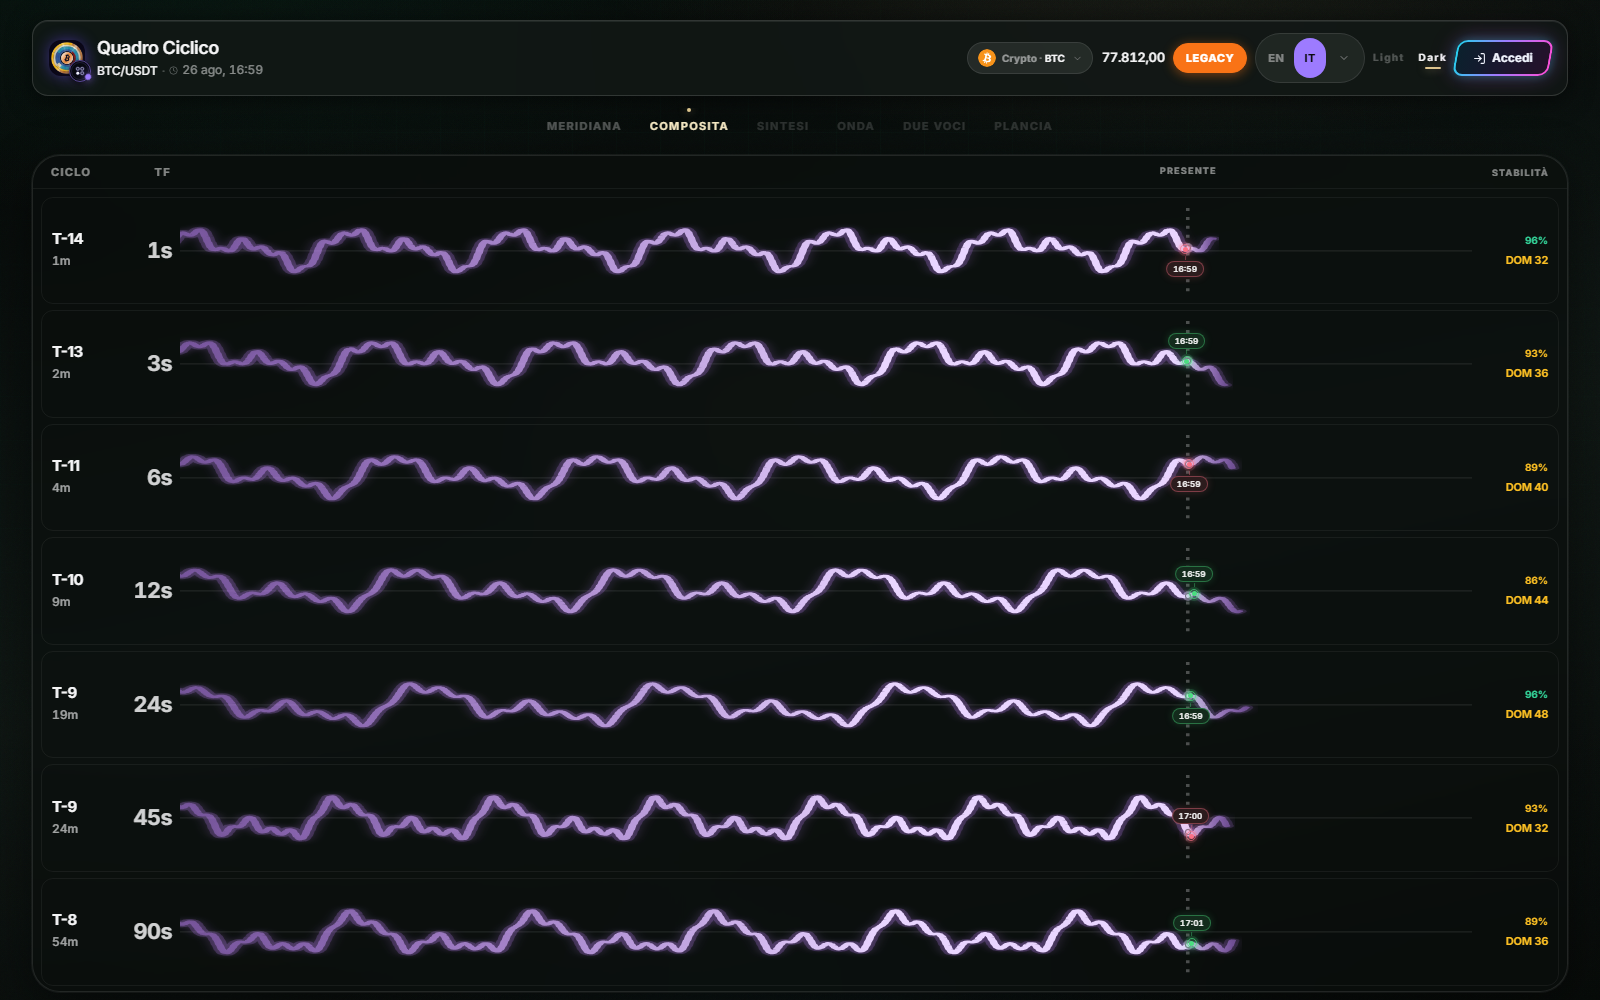
The vertical present line separates observed history from the representation beyond that reference. The right side is not a guaranteed price target.
What one row shows
The row identifies the timeframe and shows its synthetic shape. When available, DOM identifies the dominant cycle detected in the sample and STABILITY describes regularity under the displayed test. Stability is not a future success rate.
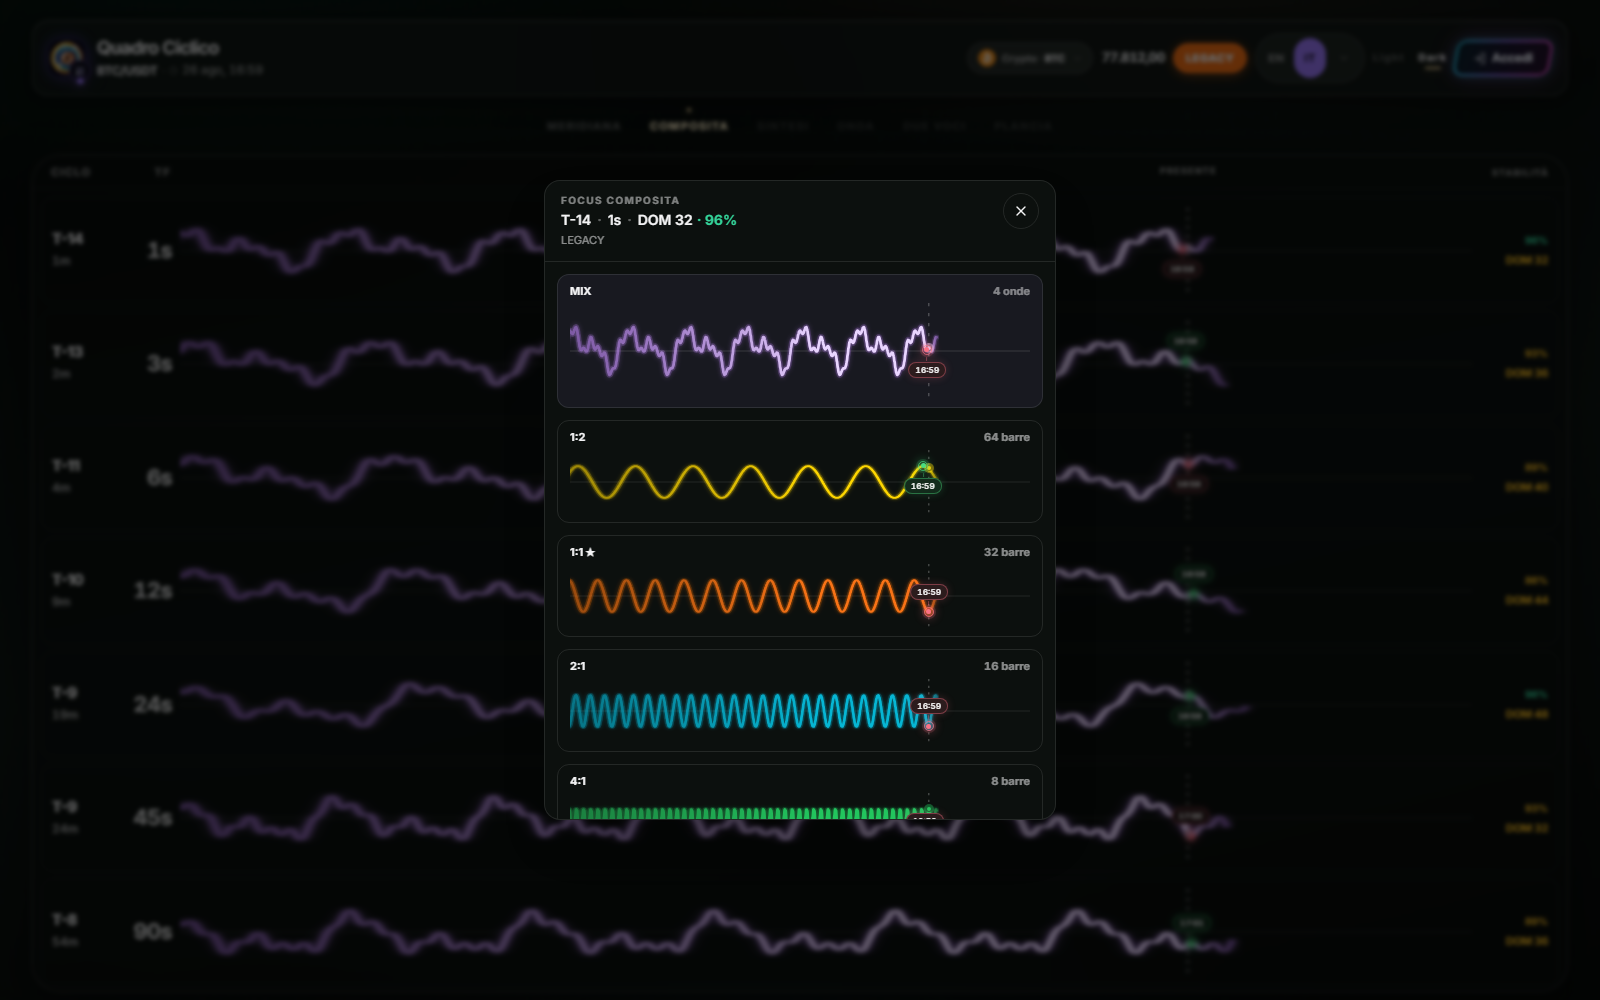
Tap or click a row to open Composite focus. Focus enlarges that timeframe; Close returns to the full stack. Opening it does not recalculate the market or change the asset.
Change mode
The top pill cycles through DOMINANT, LEGACY, DIREKTOR and BEST 3. The shape may change even without a new price move because the analytical configuration has changed.
Record asset, mode and timestamp before comparing. A similarity produced by switching configurations on the same sample is not an independent confirmation.
Do not confuse these states
Computing composites…means processing.- A missing row may mean unavailable timeframe data.
- Authentication and endpoint messages describe access or service state, not market direction.
- A flat shape can be a result; a blank surface without references needs diagnosis.
- An old timestamp means stale analysis even while the ticker moves.
Sources
- Cyclic Board in the Emiciclo app — official Composite view.
- Cyclic analysis in CycleSic — chart verification.
- Cyclepedia technical verification: stack, focus, visible indicators, calculation states and the four-mode cycle checked on 2026-08-26.