

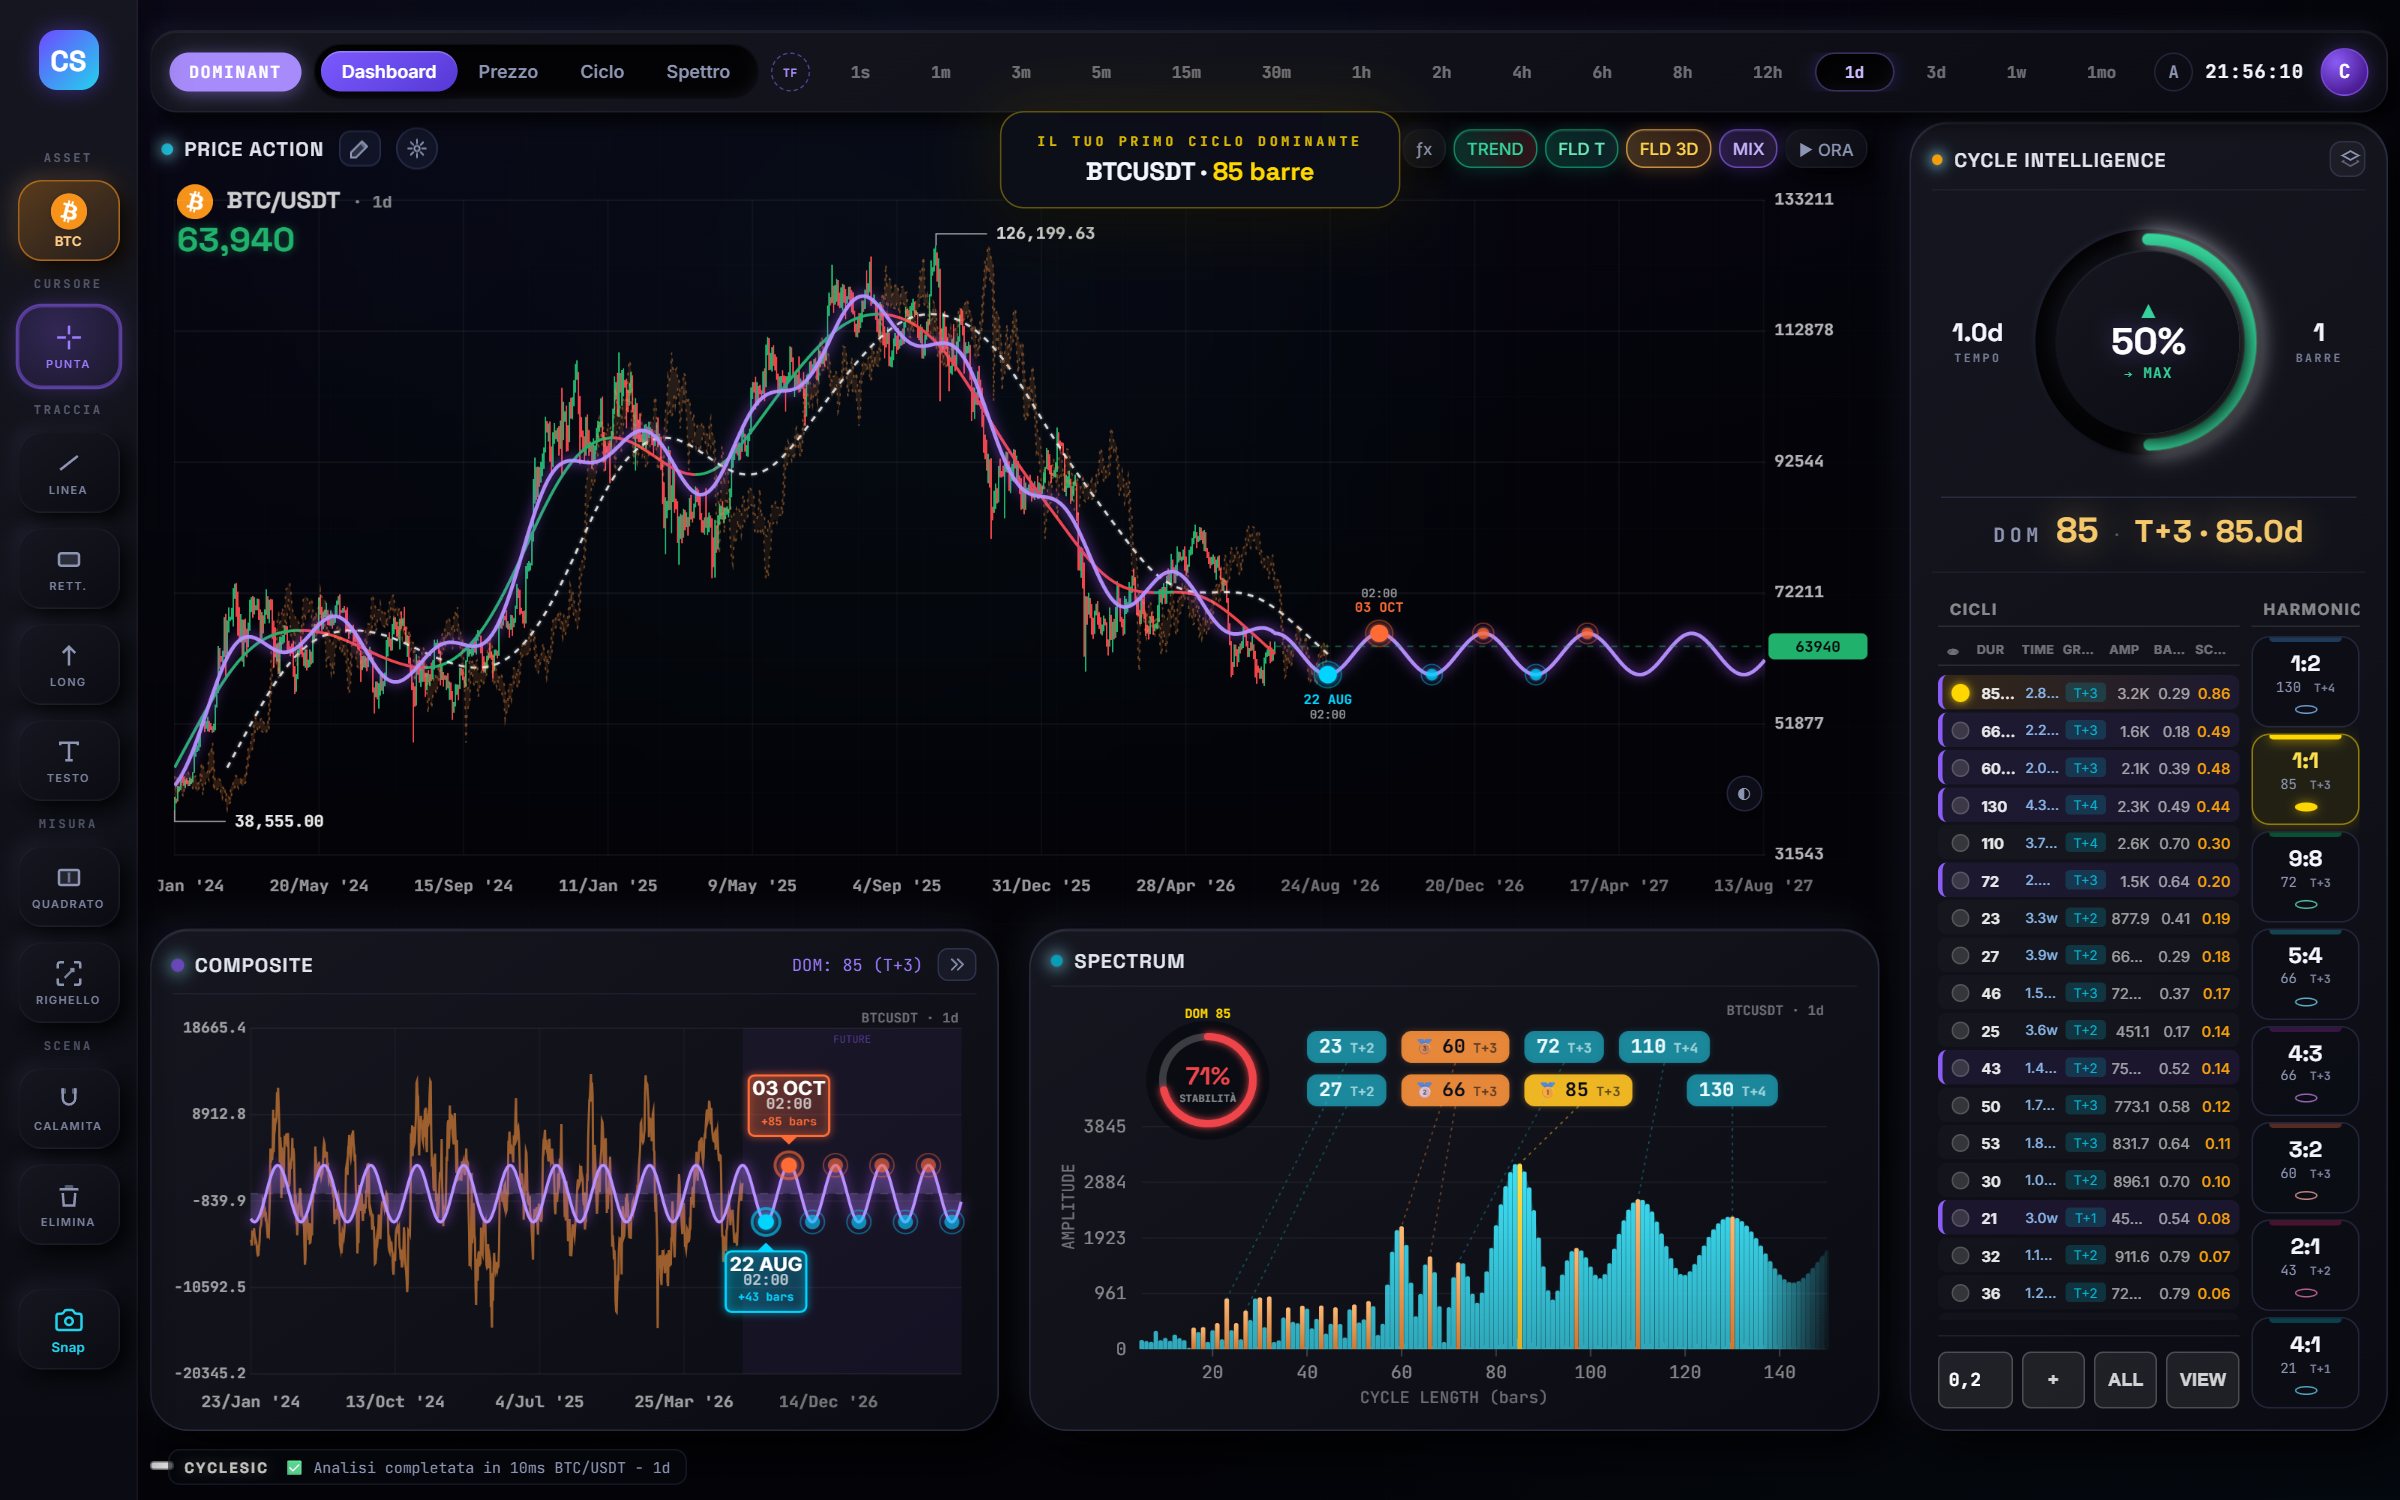
The cyclic surfaces in CycleSic help you observe different rhythms in the same market. The dominant cycle offers a reference, MIX shows the composite and the spectrum compares periodicities in the sample. They support a hypothesis; they do not provide a certain price forecast.
Documentation boundary — We explain where the tools are, which visible inputs they require, what outputs they show and what checks to perform. Proprietary formulas, weights, filters, calibration and rules remain confidential.
Before reading a cycle
Confirm asset and timeframe, check history and the latest candle, wait for panels to finish loading, record the observed window, and distinguish an empty panel from a zero output.
Open the cyclic surfaces
- Start in Dashboard for overall context.
- Select Cycle to give the cyclic surface more room.
- Select Spectrum to expand the period structure.
- Return to Dashboard to compare the output with price.
On mobile, panels continue below or beside the chart and gestures can change their visibility. Use the gesture tutorial when necessary.
The simplest reading
Start with three questions:
- What is the reference rhythm? The dominant cycle identifies the current reference component; it may change across windows and timeframes.
- How do components work together?
MIXmakes the composite visible; it is not a certain price path. - Which periodicities stand out? The spectrum shows relative evidence in the sample; a peak does not prove persistence.
Cycle Intelligence panels summarise connected information. A clearer summary does not turn the analysis into a certain trade signal.
LEGACY and DOMINANT modes
The top pill can show a mode such as LEGACY or DOMINANT, depending on configuration and access. A mode selects how the analysis is composed or presented; it does not change the asset or timeframe by itself.
To compare modes, save the visible context, change once and wait for panels to update. Do not compare values during a transition, and never treat a lock as a zero result.
MIX, TREND, FLD T and FLD 3D
- MIX shows or hides the composite linked to the current configuration.
- TREND adds the available background-component reading.
- FLD T and FLD 3D show connected FLD surfaces when the session and configuration allow them.
These controls change what is drawn. Before attributing a difference to the market, check which control is active and whether calculation has finished.
Select and compare a component
When a cycle list or table is available, identify a component by its visible duration or label, select it when the control is available, note which panels update, return to price to check time alignment, and test another window or timeframe only for a declared reason.
Expected result: the component is highlighted and connected surfaces update. An access lock must not be interpreted as the component being absent.
Read the spectrum and composite cautiously
Compare neighbouring peaks rather than only the largest, test sensitivity to the observation window, account for noise and the number of bars, and do not turn a duration directly into a reversal date. Record which components feed a composite. If the output changes with inputs, that sensitivity is part of the result.
If a setting only looks convincing after repeated searching, do not present it as independent evidence. Save the visible configuration and reduce the strength of the conclusion.
After a timeframe change
CycleSic can animate the move to the new interval. Wait until the new timeframe is highlighted and the movement has ended. Read the dominant cycle, MIX, trend, FLD and spectrum only when they all belong to the new context.
Sources
- CycleSic in the Emiciclo app — current cyclic surfaces.
- Cyclic analysis and FLD — conceptual context and limitations.
- Cyclepedia technical check: verified on 2026-08-25 against visible modes, dominant cycle, MIX, TREND, FLD, spectrum, transitions and the built-in curriculum in
cyclesic-v2/; no proprietary algorithm was reproduced.