

In plain words — The Hurst Inverse removes its average from price and keeps only the short wave swinging around zero, in a pane below the chart. It shows the pace and strength of the short cycle. It does not tell you to buy or sell.
Transparency and trade secrets — Emiciclo makes CycleSic and publishes Cyclepedia. The indicator's basic construction is the one J. M. Hurst published in 1970, explained in the inverse moving average entry. This guide documents visible controls and results; it does not publish engine calibrations, thresholds or code.
Before you start
Open CycleSic, choose asset and timeframe and check that the chart has a regular history. The Hurst Inverse is an Emiciclo tool computed on the server: a padlock on its card means the required access is missing; if the service does not answer, the pane stays empty, and empty is not a value.
Enable the Hurst Inverse
- Select ƒx Indicators.
- Open the EMICICLO family and choose Inversa Hurst.
- Close the catalogue and wait for the computation.
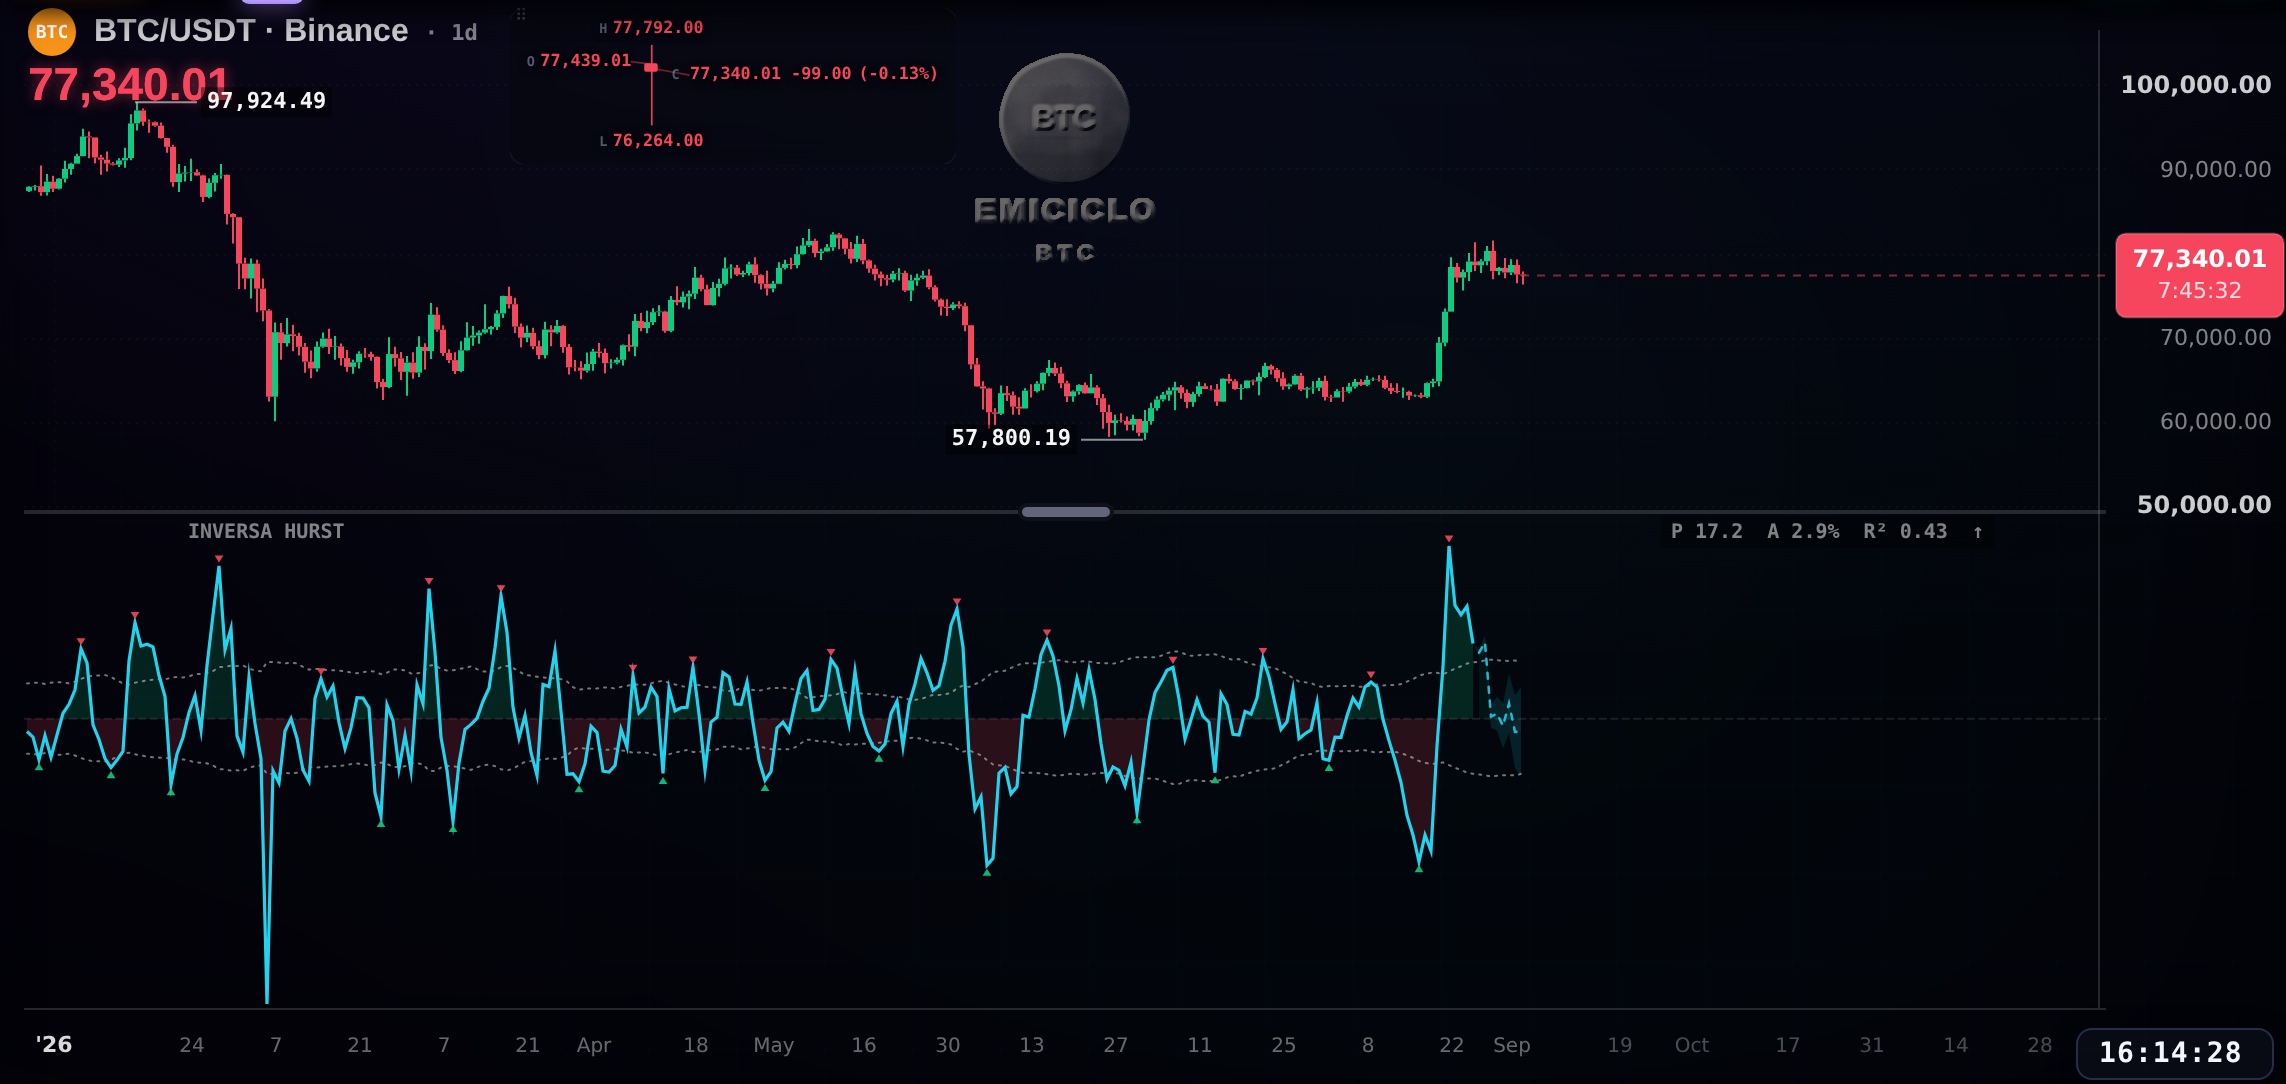
Expected result: a pane named INVERSA HURST appears below the chart, with a wave swinging around zero and a reading line at the top right.
Read the pane, from the wave to the line
- The wave and its colours. It is price minus its centred average. The fill is green while the wave sits above zero and red while it sits below: the short cycle's phase shows without reading numbers.
- The two dotted lines. They hug the wave and measure its amplitude bar by bar. Widening lines mean the short cycle is gaining strength; narrowing lines mean it is losing it.
- The triangles. ▲ marks a confirmed trough of the wave, ▼ a confirmed peak. Counting the bars between two ▲ is Hurst's way of measuring the duration the market is keeping.
- The dashed tail. A centred average looks as far ahead as it looks back, so it is still missing on the last bars. CycleSic shows them anyway, dashed, with the simplest assumption: price stays where it is. With each new bar a piece of the tail becomes final.
- The band around the tail. It shows how far the tail can still move. It is measured on the same chart's past and contains the final value about three times out of four.
- The line at the top right.
Pis the measured period in bars,Athe amplitude (percent on the log scale, currency on the price scale),R²the regularity from 0 to 1, and the arrow the wave's current direction. The line takes the wave's colour when regularity is high.
How to use R². Above 0.6 the wave really resembles a cycle and period and amplitude are reliable. Between 0.3 and 0.6 confirm the reading with other tools. Below 0.3 noise prevails: in that stretch the short cycle cannot be read.
Settings that change what you see
- Dynamic duration: on, the duration follows the dominant cycle CycleSic measures. Off, the manual duration is in charge.
- Manual cycle duration: the reference cycle in bars, 33 by default like the Hurst Envelope. Keep it equal to the Hurst Half-Span's, so both tools talk about the same cycle.
- What to isolate: Short wave removes the half-cycle average and leaves the component just faster than the reference cycle, as in Hurst's book. Trading cycle removes the full-cycle average and leaves the cycle itself, with a dashed tail twice as long.
- Scale: Auto follows the chart; prices works in currency; log works in percent and makes far-apart stretches comparable.
- PANEL group: switches for tail and band, envelope, triangles, reading line and ideal wave (the sinusoid the reading comes from, in gold). Turning them off changes the drawing only, not the computation.
Change one control at a time and always compare on the same asset and timeframe.
If it does not work
- Card with a padlock: check the session and the access the app reports.
- Empty or loading pane: check network, history and service status; a technical error is not a flat wave.
- No reading line: the wave needs enough bars to be measured; with a short history the pane shows only the wave and zero.
- The tail changes every bar: expected. It is the provisional part, and the band shows its margin.
- Triangles appearing late: a trough or peak is confirmed only after the wave has turned.
Limits to know
The Inverse describes the short cycle that has already happened and its current strength; it does not forecast the next turn. The simple average lets part of the slower components through and dampens those close to the cut-off, as Hurst documents in Appendix IV. The dashed tail is a declared estimate, and the band gives its typical uncertainty, not a guaranteed limit. Use the reading as a check on duration and amplitude together with the method's other tools.
Sources
- CycleSic in the Emiciclo app — current operating interface and access state.
- J. M. Hurst, The Profit Magic of Stock Transaction Timing, Prentice-Hall, 1970, ch. 6 and appendices IV and VI — construction of the inverse, response of the average and trigonometric fitting.
- Hurst inverse moving average — definition, construction and the edge limit.
- Cyclepedia technical check: review of 2026-10-05 of the CycleSic runtime registry, pane, painter and output contract, with a terminal screenshot; engine calibrations and code excluded.