
Who this entry is for — Anyone using LDB who wants to separate «routine» volume from volume that can start a trend. CBOT Study Guide Part VI; operational complement to Liquidity Data Bank.
Source: CBOT, Market Profile Home Study Guide (1996), Part VI. Raw:
raw/patrimonio-emiciclo/studio-steidlmayer/cbot/part-06-liquidity-data-bank.
Prerequisites
Liquidity Data Bank, Initiating vs responsive.
Who CTI2 is
| CTI | Role |
|---|---|
| CTI1 | Local / floor trader |
| CTI2 | Clearing commercial members (house account) |
| CTI3–4 | Execution for other members / public |
Estimated «outside» participation: 100 − (CTI1% + CTI2%). CTI2 have known behaviour → reliable indicator when they act unexpectedly.
Expected vs initiating behaviour
| CTI2 behaviour | Read |
|---|---|
| Buy below value / sell above | Routine — fade toward value |
| Buy above value / sell below | Initiating — longer timeframe, possible trend |
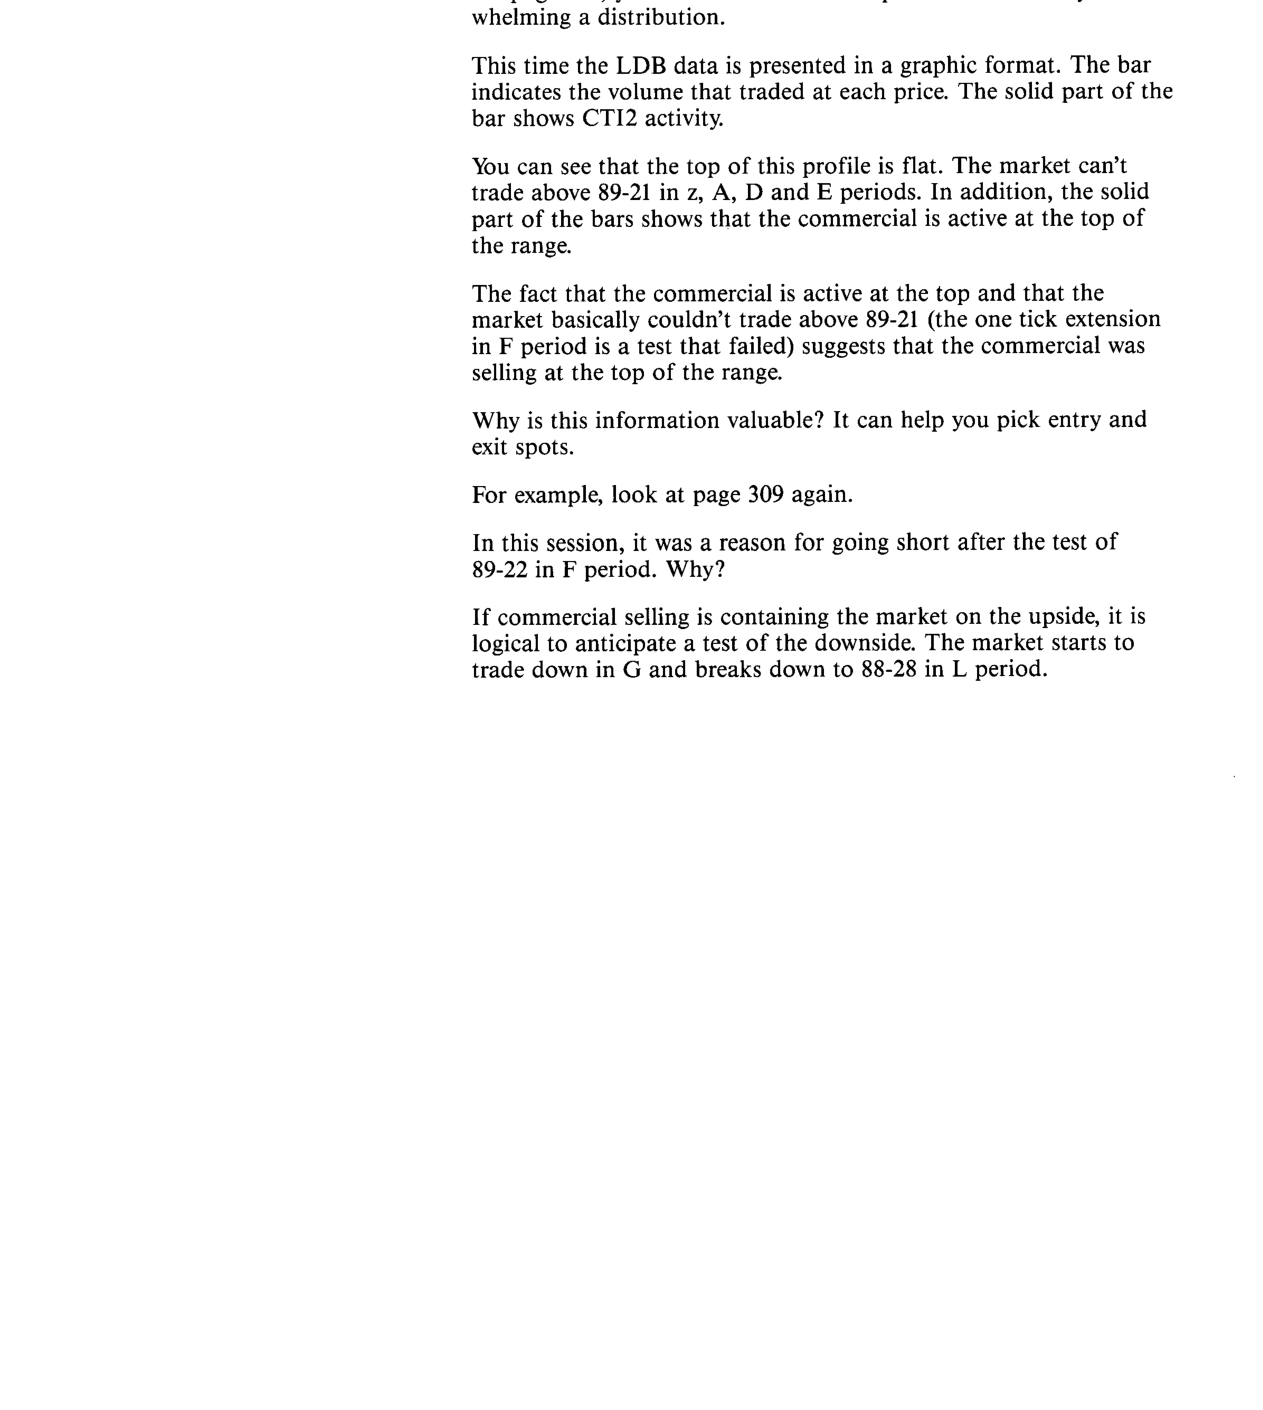
| Overwhelm at a level | Flat top or flat bottom → volumetric minus development |
| No selling at top / no buying at bottom | Commercials still see undervalued/overvalued → continuation |
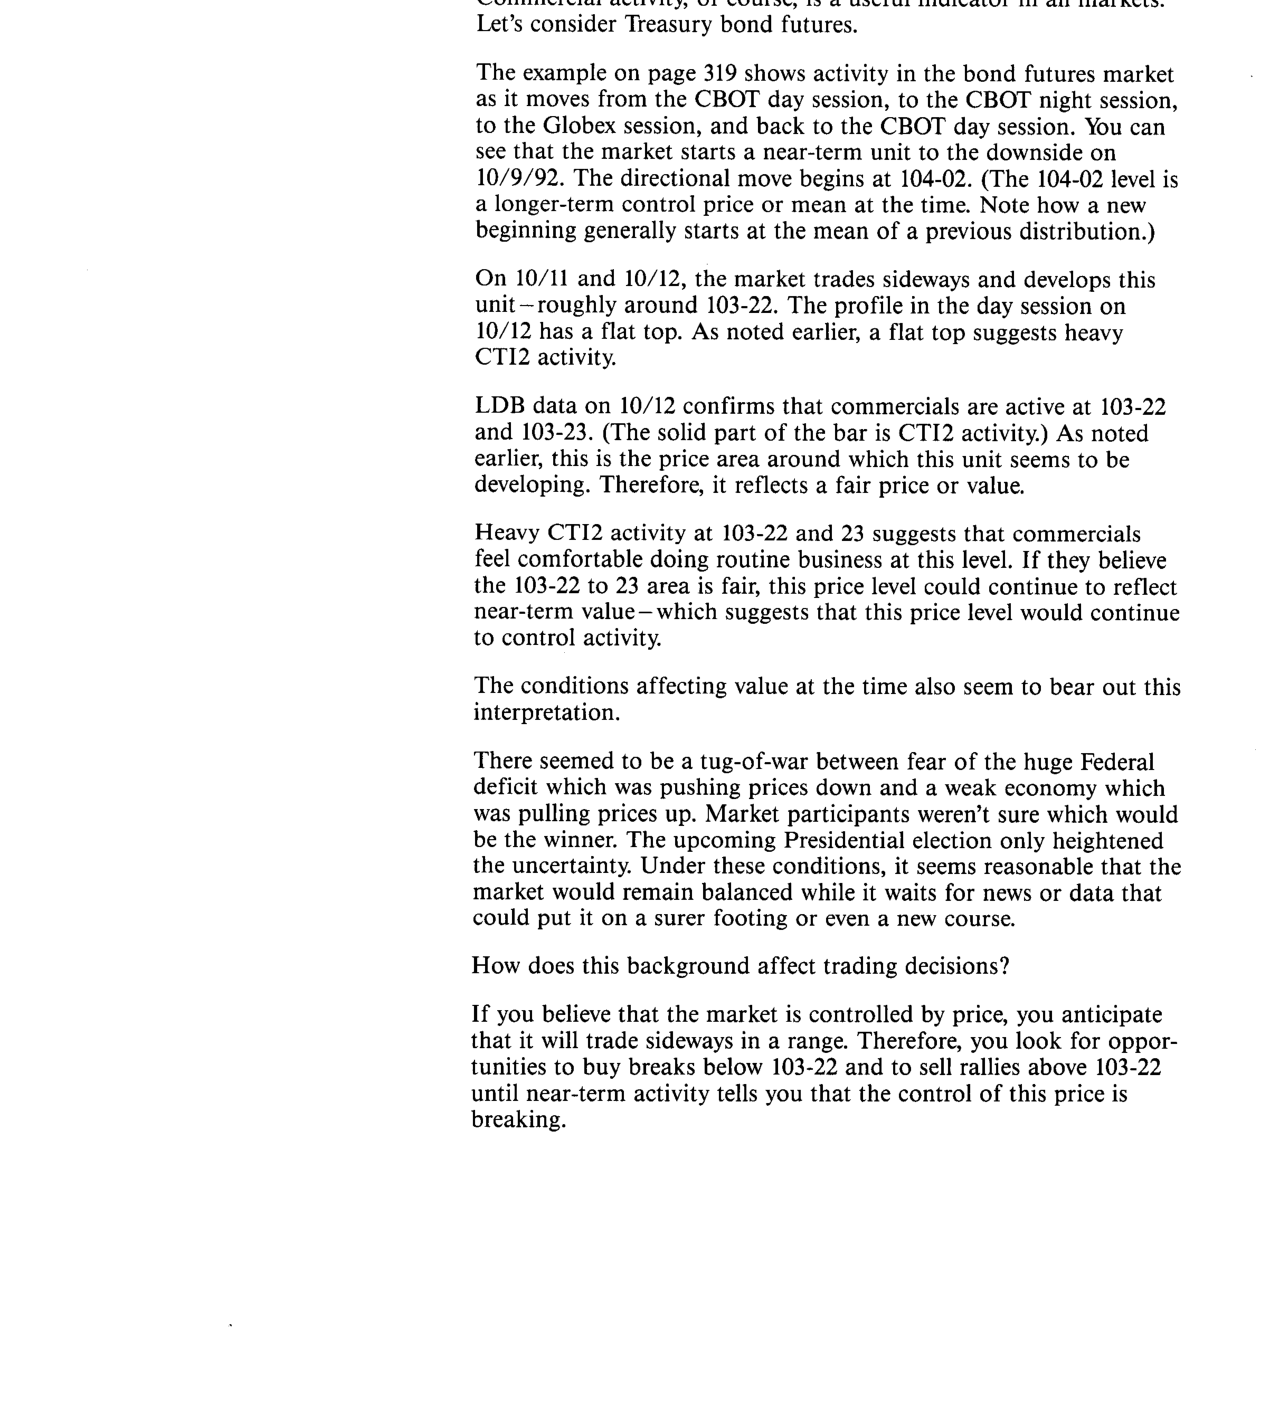
Guide cases (CBOT) — Bonds 10/9/90 flat top CTI2 → decline; bonds 24/4/91 flat bottom → rally; wheat 22/6/92 flat top at uptrend → reversal; corn 12/5/92 CTI2 buy above control price 256 → long next day.
LDB checklist (item 6)
In the six-item LDB checklist, CTI2 activity in value area weighs medium — cross with total volume, range extremes, and value area position (items 1–3 high weight).
Common mistake — Ignoring distribution-unit context. CTI2 initiating only makes sense placed in the long-period move («who?» and «where are we?»).